Tuesday, July 30, 1996
For release at 8:30 a.m.
1995
Canada's crime rate --- an indicator of public safety --- fell 1% in 1995, its fourth straight annual drop, following 30 years of almost constant increase.
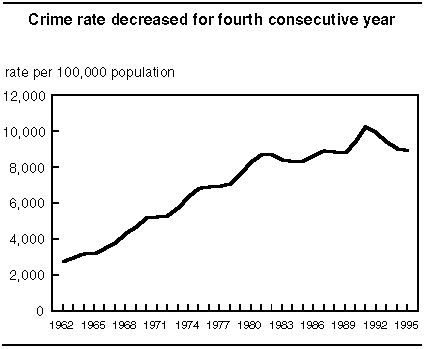 Chart: Crime rate decreased for fourth consecutive
year
Chart: Crime rate decreased for fourth consecutive
year
Many individuals involved in policing have attributed the recent decline in the crime rate to community-based policing initiatives implemented in most major police agencies.
The violent crime rate fell by 4% in 1995, the largest annual decline since the survey began in 1962. This is the third straight annual decrease following 15 consecutive years of increase. The 1995 violent crime rate was still 36% higher than it was a decade earlier.
Most categories of violent crime dropped in 1995. The rate of minor assaults, which accounted for 6 in 10 of the almost 300,000 violent crimes, declined by 3%. Over the last two years, sexual assaults have dropped 21%, a trend that was evident in all provinces.
The homicide rate dropped for the fourth straight year (-3%), reaching its lowest level since 1969. Robbery was the only violent crime category to show an increase, up 3%.
There was a general decline in incidents involving the use of firearms in 1995. The number of homicides committed with a firearm decreased by 10% --- robberies with a firearm dropped by 9% --- and offensive weapons offences, which mainly involve firearms, dropped by 7%.
After dropping for three years in a row, the property crime rate stabilized in 1995, partly due to a slight increase in residential break-ins (+3%). Break-ins at businesses fell 3%. Break-ins accounted for about a quarter of the 1.6 million property crime incidents in 1995, and thefts, about half.
Motor vehicle thefts remained stable for the second consecutive year, after a large increase between 1988 and 1993. Police reported over 160,000 stolen vehicles in 1995, about 450 every day. Almost half of all individuals charged with motor vehicle thefts were youths aged 12 to 17.
This release focuses on crime data reported by police agencies across the country. The "crime rate" refers to actual Criminal Code incidents, excluding traffic offences, per 100,000 population.
Concerns have been raised about the comparability of crime rates among police agencies which may differ in the mix of urban/suburban populations and boundaries. In response, this year's report uses the census metropolitan area (CMA) as the standard geographical unit.
Overall, the rate for youths aged 12 to 17 charged with crime remained stable in 1995 following three straight years of decline.
However, the rate of youths charged with violent crimes rose 2%. With the exception of 1994, the rate of youths charged with violent crimes has been rising steadily since 1986. The rate of youths charged with property offences dropped for the fourth straight year.
Youths tend to be charged with proportionately fewer violent offences compared to adults. Of all youths charged in 1995, 19% were charged with violent crimes, compared with 29% of adults charged.
Youths were most commonly charged with motor vehicle theft (45% of all persons charged), arson (44%), break-ins (40%) and robbery (35%).
The overall crime rate fell in five provinces --- British Columbia, Alberta, Manitoba, Newfoundland and Nova Scotia --- in 1995, with the largest drop occurring in Manitoba (-6%). It remained stable in Ontario, Quebec and New Brunswick, and rose in Saskatchewan (+5%) and Prince Edward Island (+2%).
Six of the nine largest census metropolitan areas (CMAs) reported a drop in their overall crime rate in 1995, with the largest decline (-9%) occurring in Winnipeg. The crime rate remained stable in Ottawa and Vancouver, while Québec reported a small increase (+2%).
Vancouver reported the highest crime rate, followed by Ottawa and Winnipeg. This was mainly due to significantly higher property crime rates. Québec reported the lowest crime rate, followed by Toronto and Montreal.
In terms of violent crimes, Québec reported the lowest rates for homicide, assault and sexual assault, while Hamilton was lowest for robbery. Vancouver was highest for homicide, Winnipeg for robbery, Hamilton for assault and Edmonton for sexual assault.
For property crimes, Vancouver had the highest rate of break-ins, Toronto, the lowest. Winnipeg reported the highest rate of motor vehicle theft, Québec, the lowest.
Certain types of crime, including prostitution, impaired driving and drug offences, are highly sensitive to levels of police enforcement.
The number of persons charged with impaired driving offences continued to drop in 1995, down 8%. This was the 12th straight annual decrease.
The rate of prostitution increased notably (+27%) in 1995. This increase, however, followed a 49% decrease between 1991 and 1994.
The rate of drug incidents increased slightly in 1995, largely due to a 7% increase in cannabis incidents.
Available on CANSIM: matrix 2198-2200 and tables 140103 and 150202.
Juristat: crime statistics, 1995, vol. 16, no. 10, (85-002-XPE, $10/$90) is now available. See How to order publications.
For further information on this release, contact Information and Client Services (613-951-9023; 1-800-387-2231), Canadian Centre for Justice Statistics.
Table: Police-reported incidents, by most serious offence
______________________________________________________________________________
                                        1995                  1994 to 1995
______________________________________________________________________________

                                  number             rate(1)   % change in
                                                                      rate

Violent crime                    294,704              995             -4.1
Homicide                             586                2             -2.9
Attempted murder                     932                3             -0.1
Assaults                         230,167              777             -3.9
Sexual assaults                   28,216               95            -12.1
Other sexual offences              3,490               12             -9.7
Robbery                           30,273              102              3.1
Abduction                          1,040                4             -9.0

Property crime                 1,550,492            5,237              0.5
Break and enter                  390,726            1,320             -0.5
Motor vehicle theft              163,293              552              1.2
Other thefts                     861,293            2,909              0.8
Having stolen goods               31,128              105              2.1
Fraud                            104,052              351             -0.4

Other Criminal Code
  crimes                         805,862            2,722             -2.7
Mischief                         379,878            1,283             -5.4
Prostitution                       7,165               24             27.0
Arson                             13,228               45             -3.3
Offensive weapons                 17,502               59             -8.5
Other                            388,089            1,311              0.1

Total Criminal Code
  crimes, excluding
  traffic crimes               2,651,058            8,954             -1.0

Impaired driving                 101,074              341             -7.3
Other Criminal Code
  traffic crimes                  71,363              241            -10.4
Drugs                             61,660              208              1.3
Other federal statutes            36,033              122            -12.2

Total federal statutes         2,921,188            9,867             -1.6

______________________________________________________________________________


                             Youths aged
                                   12-17
______________________________________________________________________________

                              % of total
                                 persons
                                 charged

Violent crime                         16
Homicide                              13
Attempted murder                      11
Assaults                              15
Sexual assaults                       15
Other sexual offences                 16
Robbery                               35
Abduction                              5

Property crime                        30
Break and enter                       40
Motor vehicle theft                   45
Other thefts                          31
Having stolen goods                   28
Fraud                                  7

Other Criminal Code
  crimes                              19
Mischief                              32
Prostitution                           3
Arson                                 44
Offensive weapons                     21
Other                                 16

Total Criminal Code
  crimes, excluding
  traffic crimes                      23

Impaired driving                     ...
Other Criminal Code
  traffic crimes                     ...
Drugs                                 12
Other federal statutes                28

Total federal statutes               ...

______________________________________________________________________________


(1)  Rates are calculated based on 100,000 population.
(...)  Figures not applicable.
Table: Crime rates for CMAs(1)
______________________________________________________________________________
                                   Violent crime                  Property
                                                                     crime
                           ______________________________    _____________
                                    1995        1994-1995             1995
______________________________________________________________________________

                                    rate         % change             rate

Population 500,000 and
  over
Vancouver                          1,300             -1.5           10,073
Ottawa                             1,000             -1.8            7,039
Winnipeg                           1,198             -7.1            6,668
Edmonton                             921             -4.2            5,291
Hamilton                           1,141              2.6            5,072
Calgary                              741            -11.0            5,397
Montreal                             867             -9.7            5,158
Toronto                              909             -5.5            4,499
Québec                               579             -3.8            4,120

Population 250,000 to
  499,999 (2)
Victoria                           1,355             -5.6            7,372
London                               962             -7.6            6,673
Halifax                            1,156             -6.1            5,499
Windsor                              862             -7.4            4,903
St. Catharines--Niagara              656             -8.0            5,277
Hull                                 689             -5.1            4,614
Kitchener                            613            -18.1            4,679

Population 100,000 to
  249,999
Regina                             1,148              8.9            9,650
Thunder Bay                        1,818             -6.5            6,649
Saskatoon                          1,236             11.2            6,501
Sudbury                            1,133              2.3            5,383
Saint John                           831             -9.7            3,618
St. John's                         1,327              2.2            3,489
Sherbrooke                           409            -10.1            4,381
Trois-Rivières                       515             -0.5            4,122
Chicoutimi--Jonquière                630             -6.4            3,960

______________________________________________________________________________


                                Property      Total Criminal Code crimes
                                   crime
                           _____________    ______________________________
                               1994-1995             1995        1994-1995
______________________________________________________________________________

                                % change             rate         % change

Population 500,000 and
  over
Vancouver                            6.2           14,516             -0.7
Ottawa                               3.3           11,008              0.2
Winnipeg                            -9.7           10,543             -8.7
Edmonton                            -5.4            8,573             -5.1
Hamilton                            -0.1            8,544             -1.0
Calgary                             -7.6            7,889             -7.2
Montreal                            -3.2            7,776             -3.9
Toronto                              0.1            7,452             -2.5
Québec                               1.9            6,082              2.2

Population 250,000 to
  499,999 (2)
Victoria                            -2.4           12,683             -1.6
London                               8.0           10,719              1.4
Halifax                             -4.6            9,198             -8.1
Windsor                              3.5            8,550              0.5
St. Catharines--Niagara              2.3            8,340             -1.6
Hull                                 9.8            7,900              4.9
Kitchener                            8.9            7,165              0.8

Population 100,000 to
  249,999
Regina                               8.6           14,601             11.2
Thunder Bay                         -6.8           12,633             -7.2
Saskatoon                            9.5           10,996              7.7
Sudbury                            -12.0            9,022             -8.3
Saint John                          -5.7            6,822             -2.7
St. John's                          -6.8            6,471             -3.7
Sherbrooke                          -7.7            6,412             -5.7
Trois-Rivières                      -4.6            6,374             -4.9
Chicoutimi--Jonquière                9.2            5,974              8.0

______________________________________________________________________________


(1)  Rates are calculated per 100,000 population.
(2)  The Oshawa CMA is excluded from this table due to methodological
     concerns with the matching of the police agency jurisdictional
     boundaries and the CMA boundaries.
1995
Canada's homicide rate fell for the fourth straight year in 1995, reaching its lowest point since 1969. Police reported 586 homicides in 1995, 10 fewer than the previous year.
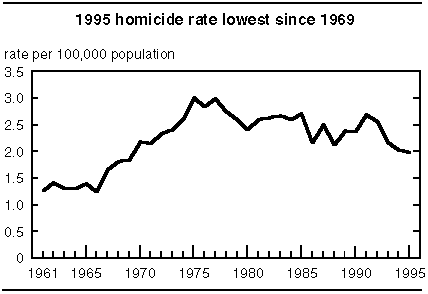 Chart: 1995 homicide rate lowest since 1969
The 1995 rate of 1.98 homicides per 100,000 people was 3% lower than in 1994, well below the 1975 peak of 3.02. The homicide rate more than doubled between 1961 and 1975. Since then, despite annual fluctuations, the rate has been gradually decreasing.
Compared with the United States, Canada's homicide rate is relatively low. The U.S. rate, according to preliminary 1995 data, was more than four times that of Canada's. However, Canada's homicide rate is generally higher than many European nations. The rate for England and Wales, for example, was 30% lower than Canada's.
Most provinces reported a decrease in their homicide rate in 1995; only three reported minor increases: Quebec, British Columbia and Newfoundland. The increase in Quebec followed a 26-year low reached in 1994, and was well below the province's average rate over the last decade. Rates in both British Columbia and Newfoundland were close to their 10-year average.
In general, homicide rates in the provinces continued to be highest in the West. For the fourth straight year, British Columbia recorded the highest rate, followed by Manitoba and Alberta. The homicide rates in both Manitoba and Saskatchewan were the lowest in nearly 30 years. Prince Edward Island, with one homicide, recorded the lowest rate, followed by Newfoundland and Ontario.
Table: Homicides by province/territory
1994 and 1995
______________________________________________________________________________
                                        1994                          1995
______________________________________________________________________________

                                  number         rate per(r)        number
                                                  100,000
                                               population

Canada                               596             2.04              586
Newfoundland                           4             0.69                5
Prince Edward Island                   1             0.74                1
Nova Scotia                           19             2.03               16
New Brunswick                         15             1.98               14
Quebec                               126             1.73              135
Ontario                              192             1.76              181
Manitoba                              29             2.57               27
Saskatchewan                          24             2.37               21
Alberta                               66             2.43               59
British Columbia                     113             3.08              120
Yukon                                  3            10.10                4
Northwest Territories                  4             6.18                3

______________________________________________________________________________


                                    1995
______________________________________________________________________________

                                rate per
                                 100,000
                              population

Canada                              1.98
Newfoundland                        0.87
Prince Edward Island                0.73
Nova Scotia                         1.71
New Brunswick                       1.84
Quebec                              1.84
Ontario                             1.63
Manitoba                            2.37
Saskatchewan                        2.07
Alberta                             2.15
British Columbia                    3.19
Yukon                              13.29
Northwest Territories               4.56

______________________________________________________________________________


(r)  Revised figures.
The nine largest census metropolitan areas (CMAs) accounted for 48% of Canada's population, but 54% of homicides. Among these nine, Vancouver reported the highest rate, followed by Ottawa and Hamilton. Ottawa recorded its highest rate since CMA data were first produced in 1981, and Hamilton's rate was its highest since 1983.
Québec, with four homicides, reported the lowest rate for the second consecutive year, followed by Toronto and Calgary. Both Québec and Edmonton experienced their lowest homicide rates since 1981.
Table: Homicides by CMA
1994 and 1995
______________________________________________________________________________
CMA, 500,000+                           1994                          1995
population
______________________________________________________________________________

                                  number         rate per(r)        number
                                                  100,000
                                               population

Toronto                               85             2.00               74
Montreal                              75             2.27               77
Vancouver                             48             2.70               64
Ottawa-Hull                           17             1.68               28
  Ontario                             12             1.58               24
  Quebec                               5             2.01                4
Edmonton                              24             2.72               19
Calgary                               18             2.22               17
Québec                                11             1.60                4
Winnipeg                              18             2.67               16
Hamilton                              13             2.04               17
Total                                309             2.20              316

______________________________________________________________________________


CMA, 500,000+                       1995
population
______________________________________________________________________________

                                rate per
                                 100,000
                              population

Toronto                             1.71
Montreal                            2.31
Vancouver                           3.50
Ottawa-Hull                         2.73
  Ontario                           3.10
  Quebec                            1.59
Edmonton                            2.15
Calgary                             2.05
Québec                              0.58
Winnipeg                            2.37
Hamilton                            2.65
Total                               2.22

______________________________________________________________________________


(r)  Revised figures.
While the homicide rate for adults has been decreasing over the past decade, the rate for youths aged 12 to 17 has remained relatively stable. From 1985 to 1994, the youth rate fluctuated between 1.5 and 2.5 homicides per 100,000 youths. While the 1995 rate of 2.7 was higher than average, because of the small numbers, it is difficult to determine whether this represents the start of a new trend or if it is simply normal year-to-year fluctuation.
Police reported 65 youths charged with homicide in 1995, 8 more than in the previous year and the second straight increase. It was the highest number of youths charged in a single year since 1975.
In 1995, 176 homicides were committed with a firearm, 20 fewer than in 1994, and the lowest total since 1988. However, homicides account for a relatively small portion of firearm deaths. The latest figures available (1994) show that over three-quarters of all firearm deaths were suicides, with homicide accounting for a further 16%.
Firearms continue to be used in about one in every three homicides. In 1995, slightly more victims were killed by stabbing (31%) than by shooting (30%). Over the past decade, the use of handguns has increased, from 7% to 16% of all homicides, while the use of rifles/shotguns has decreased, from 20% to 10% of all homicides.
Homicides are more likely to be committed by someone known to the victim than by a stranger. Where an accused was identified, almost half (47%) of victims were killed by an acquaintance, slightly more than a third (36%) by a spouse or other family member, and 16% by a stranger (2% unknown). These proportions have remained relatively constant over the past 10 years.
Spousal homicides continue to account for one out of every six solved homicides. In 1995, 90 persons were killed by either a current or former spouse --- 69 women and 21 men --- up slightly from 85 the previous year. From 1985 through 1994, an average of 110 persons were killed by a spouse each year, with women representing three-quarters of these victims.
In 1995, women were six times more likely to be killed by a spouse than by a stranger. Of those women who were in a registered marriage and who were killed by their spouse, almost one in four were separated at the time of the incident. Various studies have shown that wives are particularly at risk during the first two months after separation.
Males have consistently comprised the majority of homicide victims as well as the majority of those accused of committing homicide. In 1995, 67% of homicide victims were male, as were 87% of accused.
Violence against children is a source of major concern to Canadians. In total, 52 children under the age of 12 were killed in 1995, compared with an average of 56 each year since 1985. Of the 52 children killed in 1995, 8 were infants. This was a large drop from the average of 20 infants killed each year over the previous decade.
Juristat: Canadian crime statistics, 1995, vol. 16, no.
10
Catalogue number 85-002-XPE
(Canada: $10/$90; United States: US$12/US$108; other countries:
US$14/US$126).
Juristat: homicide in Canada, 1995, vol. 16, no. 11
Catalogue number 85-002-XPE
(Canada: $10/$90; United States: US$12/US$108; other countries:
US$14/US$126).