
3
The Misuse of Firearms in
New Zealand
There are three principal forms of firearm misuse in New Zealand: criminal; suicidal; and accidental. Part 3 attempts to quantify each of these in turn. The question of what can be done to reduce the risk of misuse is considered later in parts 4 and 6.
The submissions to this Review made it clear that for most people firearms control is essentially about reducing or preventing the criminal misuse of firearms. For non-shooters (an increasingly large section of the New Zealand public) firearms are now generally associated with crime or violence and only slightly with any legitimate use. Those in urban society are unlikely to encounter firearms as part of their normal lives, and their impressions of firearms are more influenced by news reports and drama than by first-hand experience of their use on the farm, in the hills, or on the shooting range. Equally, most shooters are deeply concerned about the level of firearm crime, not least because they see it directly affecting their lawful use of firearms in work, sport or recreation. Thus concerns about the level of firearm crime ran through the whole range of submissions, and provided the one common thread in this debate.
This section of the report attempts:
Ÿ to identify the principal forms of criminal misuse of firearms;
Ÿ to quantify, as much as possible, the size of the risks and to place them in context; and
Ÿ to identify the trends in criminal misuse of firearms.
The principal sources of information used in the preparation of this section have been police statistics. It is important to keep in mind that such statistics tell only part of the story. A recent Ministry of Justice publication observes that:
[F]luctuations in crime rates may be as much affected by changes in reporting by the public and recording by the police, as by changes in the actual level of offending.
Similar observations about the limited value of police statistics in assessing crime levels have frequently been expressed overseas.
In New Zealand the importance of reporting rates has most recently been recognised in the findings in the Report by Young and others to the Victimisation Survey Committee that less than 13 percent of the offences disclosed in the survey had been reported to the police, and in the Ministry of Justice paper, that:
The 1992- 95 increase [in recorded violent offending] was so rapid that changes affecting the reporting of violence seem a more likely explanation than changes influencing the actual level of offending. Increased reporting could be due to the strong focus on violence by the Police and other agencies in recent years, and the increasing awareness of violence as an issue following intense publicity on domestic violence.
Deficiencies in police recording of reported offences may not have had as much an influence on the statistics as variations in reporting, but cannot be disregarded. For example, a survey of 453 police files for the purposes of this Review found that 29 percent of the cases appearing in the official offence statistics were miscodes or non-offence situations.
Despite these limitations, there is no option but to use police statistics, as the best information available, if any progress is to be made. The sections that follow endeavour to limit conclusions to those which are justified on the basis of the information available, taking into consideration its inherent limitations.
3.1.2 Overall levels of crime—and violent crime
Any consideration of firearm crime must have regard to the broader context of current and historical trends in offending and violent offending in New Zealand. The starting point is the graph which shows the total number of reported offences per 1,000 people between 1895 and 1995.

Source: Statistics New Zealand, New Zealand Now Crime Tables (1996)
This shows a stable rate of crime per head of population between 1895 and 1950, a steady rise over the next 40 years to a peak of 145 offences per 1,000 people in 1992, and a slightly reduced level of 141 offences per 1,000 people in 1995. It is widely believed that changed reporting, charging and recording practices are the cause of part of the rise, but if these are excluded the fact of a major increase from 1960 to 1990 remains. Statistics New Zealand has recently postulated a wide variety of reasons for the escalation, including:
… increased urbanisation and population density, changing social attitudes, the increasing opportunities for crime in a consumer society, changes to the age structure of the population, changes in reporting and recording practice, and the gradual introduction of new categories of offence.
By a significant margin, it is the "dishonesty" offences which make up the bulk of current reported offences. These offences include theft, burglary and vehicle offences.
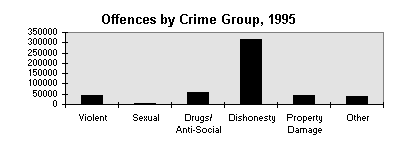
Source: Statistics New Zealand, New Zealand Now Crime Tables (1996)
In contrast, sexual and other violent offences make up less than 10 percent of the total. Nonetheless these offences have more than doubled in the last decade and a half— including the period when total offending levelled off. Since then, the number of violent offences appears to have plateaued, although it is too soon to tell whether this plateau will last.

Within the trend to higher levels of violence the largest increase has been in serious assaults, which have become the most common form of violent offending, taking the place of minor assaults. Much of the increase may be attributable to family violence, which has become both more widely reported and more seriously dealt with by police during the period. This is indicated by the level of reported Male Assaults Female offences which increased by over 500 percent between 1985 and 1995¾ from 1,548 offences to 9,573 offences. However, the increase in family violence is not the only explanation¾ over the period there have been significant increases in grievous assaults, robbery, intimidation and other violent offences.
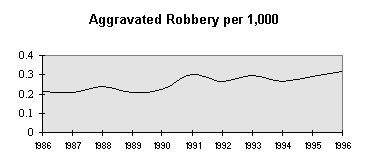
In 1996, there was the highest number of aggravated robberies in any year over the past decade¾ 1,171, up from 942 in 1994. When put on a population basis this shows a relatively steady increase totalling 50 percent over the past ten years.
Source: New Zealand Police
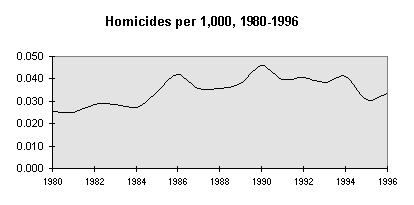
In the case of the highest profile violent offence, murder, the rate
has been relatively steady over the last decade. In 1995 there was the lowest number of
murders in any year during
the previous decade¾ 45, down from 72 in 1994. This number
increased to 59 in 1996, but remained at less than the average number of
murders—67—over the past ten years. The inclusion of manslaughter in the
following graph does little to alter the overall trend.
This brief survey of crime levels shows principally that:
Ÿ the level of total offending rose steadily from 1960, peaked in or around 1992, and has fallen slightly since then;
Ÿ recorded levels of violence have increased throughout most of the last two decades, even when total offending slowed; and
Ÿ even though some of the apparent growth in violent offending is attributable to changes in reporting practices or police policy, and the rate of homicide has levelled or fallen over the last decade, current levels of violence are historically high, and appearing to be increasing still in some classes of offence.
It follows that, although the picture is not all of a piece, public concerns about the level of violence, and in particular serious violence, are not without justification.
Firearm crime is recorded by the police in three categories:
Ÿ Crime Act offences;
Ÿ Arms Act offences (danger to life); and
Ÿ Arms Act offences (administrative).
Crimes Act offences are the most serious and include such offences as homicide, robbery, serious assaults and threats to kill. The Arms Act danger to life category includes offences such as reckless use of a firearm, presenting a firearm at a person, and discharging a firearm near a place or dwelling. For statistical purposes all such offences are included in the total whether or not a life was actually endangered. Arms Act administrative offences include such matters as being in possession of a firearm without a licence, unlawfully carrying a firearm and failing to notify a change of address.
In all three categories there was a rise in the level of reported offences from 1980 to 1991, since when there has been little change. The following combined graph is typical of all categories.
Source: New Zealand Police
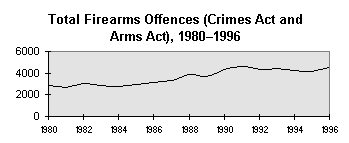
In absolute numbers, Crimes Act firearms offences and Arms Act danger to life offences are currently running at approximately 2,500 per annum. The total, including administrative offences, is 4,000 to 4,500 per annum.
The trend over this more recent period has been reasonably steady¾ if anything downwards if population increases are taken into account.
One area which has shown a substantial recent increase is the number of Armed Offenders Squad call-outs. These have increased substantially over the past ten years. However, inquiries from the Armed Offenders Squads produced advice that they have changed their role from that of a reactive force to that of a proactive force and have taken on new duties, such as payroll and witness protection. They confirm that in fact the number of incidents involving the use of firearms has either been static or reducing over recent years.
Firearms Offences, 1991–1996
| Category | 1991 |
1992 |
1993 |
1994 |
1995 |
1996 |
| Crimes Act | 754 |
647 |
714 |
675 |
680 |
758 |
| Danger to life | 2,026 |
1,790 |
1,779 |
1718 |
1,684 |
1,748 |
| Administrative | 1,881 |
1,875 |
1,977 |
1,833 |
1,801 |
2,030 |
| Total | 4,661 |
4,312 |
4,470 |
4,226 |
4,165 |
4,536 |
Source: New Zealand Police
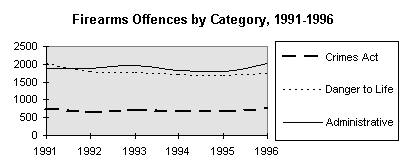
Source: New Zealand Police
The current level of reported firearms offending is around 63 percent higher than in 1983.
The most common forms of reported firearms offending in New Zealand are as shown in the following tables.
| Offence | Average annual total (last five years) |
| Aggravated robbery | 232 |
| Threatening to kill | 181 |
| Assaults | 65 |
| Murder/attempted murder | 22 |
| Possession of offensive weapon | 21 |
| Threatening behaviour | 25 |
Source: New Zealand Police
Arms Act (Danger to Life) Offences
| Offence | Average annual total (last five years) |
| Discharging a firearm near a dwelling | 796 |
| Presenting firearm | 258 |
| Reckless discharge of a firearm | 210 |
| "Other offence re firearm use" | 149 |
| Use of a firearm | 60 |
| Intoxicated in charge of a firearm | 73 |
| Presenting object like a firearm | 94 |
| Careless use of firearm causing death | 34 |
| Use of firearm in crime | 41 |
Source: New Zealand Police
Arms Act (Administrative) Offences
| Offence | Average annual total (last five years) |
| Unlawfully carrying a firearm | 550 |
| Possession of firearm without a licence | 316 |
| Unlawfully possessing a pistol/restricted weapon | 227 |
| Unlawful possession of a firearm in a public place | 174 |
| Possession of airgun without a licence | 106 |
| Unlawfully carrying an imitation firearm | 93 |
Source: New Zealand Police
The results of the National Survey of Crime Victims suggest that firearms are more frequently used in "threat offences" than in actual assaults or robberies. Of the offences disclosed in that survey, firearms were involved in: 30.1 percent of threats; 3.9 percent of robberies; and 0.5 percent of assaults. The use of firearms to threaten is a subject returned to below in the consideration of family violence.
Firearms as a Proportion of Violence
In overall terms firearms are not by any means a dominant feature of violence in New Zealand. Police statistics show firearm crime to be only a very small proportion of violent crime, in the region of 1.7 percent, barely visible on a graphic representation.
Source: New Zealand Police
The proportion increased to over 2.5 percent in 1991, but appears since to have returned to around the 1.7 percent level.
The recent National Survey of Crime Victims reported that firearms were used in 3 percent of violent offences. The difference most probably represents offences disclosed by victims which were not reported to the Police.
Source: New Zealand Police
The above data indicate that over the 15 years the violent firearms offence rate and the rate of all violent offending rose by similar proportions, the actual rises on the statistics being 180 percent and 189 percent respectively.
When the focus switches to the most serious violent offence, homicide, the proportion of cases involving firearms increases. During the period 1978 to 1987 the proportion was 18.4 percent. This proportion had increased to 23 percent over the period 1988 to 1995. Over the same period, the proportion of murders involving firearms was even greater, at 26 percent.
Of course the fact that firearms violence is less frequent than some other forms of violence does not mean that it is unimportant. The importance of any risk must be related both to the likelihood of it occurring, and the seriousness of the consequence if it does. Although compared to many other risks firearms offending remains reasonably rare, the current level of around 2,500 danger to life and Crimes Act offences a year is by no means inconsiderable. And as to consequences, firearms offending can and not infrequently does cause grave consequences for its victims.
The relative rarity of firearms offending should not cause the public, the Police or the Government to treat it otherwise than seriously, nor to fail to investigate reasonable strategies to reduce firearm crime. But such strategies must commence with a realistic understanding of the size of the problem which requires control.
1. Reported firearms offending increased in absolute numbers by about 67 percent from 1984 to 1991, since when there has been little change.
2. Increases in firearm crime have been less than in all violent crime but have followed the trend of the latter sufficiently closely to make it probable:
a) that firearm crime is a sub-set of violent crime rather than a separate phenomenon; and
b) that violence is leading firearm crime, not the reverse.
3. Even if less than those of violent crime in general, the current levels of firearms offending are sufficiently high to give reasonable grounds for public concern.
Mass killings, involving the murder of several people in the same general area at roughly the same time, have become an occurrence of worrying frequency over recent decades in many countries of the world, including New Zealand. There have been a number of these incidents involving firearms in Australia and New Zealand during the past ten years, including:
Ÿ Raurimu¾ 1997
Ÿ Port Arthur (Bryant)¾ 1996
Ÿ Hillcrest, Queensland (May)¾ 1996
Ÿ Dunedin (Bain)¾ 1995
Ÿ Cangai, NSW (Leabeater)¾ 1993
Ÿ Terrigal, NSW (Baker)¾ 1992
Ÿ Paerata, near Auckland (Schlaepfer)¾ 1992
Ÿ Strathfield, NSW (Frankum)¾ 1991
Ÿ Aramoana (Gray)¾ 1990
Ÿ Surrey Hills, NSW (Evers)¾ 1990
Ÿ Oenpelli, NT (Rostron)¾ 1988
Ÿ Queen St, Victoria (Vitkovic)¾ 1987
Ÿ Canley Vale, NSW (Tran)¾ 1987
Ÿ Hoddle St, Victoria (Knight)¾ 1987
Ÿ Top End, NT/ WA (Schwab)¾ 1987
To this list may be added the shootings by Hamilton in Dunblane, Scotland, in 1996.
While the frequency of these incidents is worrying¾ they were virtually unheard of in the first half of the century¾ they remain a minority of firearms homicides, and an even smaller proportion of all homicides. Those killed in the Aramoana, Bain and Schlaepfer shootings represented 26 percent of total firearm homicides over the same period. Rather like aeroplane crashes, the social impact of these incidents derives less from their frequency than from their magnitude.
The magnitude of such incidents over the past decade, together with their apparently increasing frequency, the often indiscriminate choice of victims and the intense media attention which they attract, have combined to cause public concern throughout the Commonwealth. In the United Kingdom, Australia and Canada that concern has been translated into legislative amendments of sizeable proportions; see part 4.4.
While the deeply felt public abhorrence of mass killings has led to a great desire to do something about them, nowhere has there been a clear consensus as to their causes, nor as to measures which are likely to prevent them.
There has been a conspicuous lack of agreement on two issues: the role of "mental health" and the role of firearms, especially military style firearms. By way of example, the submission to this review of the Sporting Shooters Association of New Zealand addresses six major incidents, including Port Arthur and Dunblane, and declares that "each of these people, as we have come to expect, has had a long history of mental health problems and violent behaviour." By contrast, the conclusion of Reece Walters writing in the newsletter of the Institute of Criminology in Wellington is that:
In reality, the majority of mass murderers are not registered as mental patients at the time of their killings, are not taking prescription drugs for mental illnesses and, indeed, have never been treated for mental illness. They are not psychotic or psychopathic and generally do not exhibit characteristics capable of forewarning their actions. Up until the point of their offences they demonstrate ‘ordinary’ characteristics. They may have a predisposition to bad temper, moodiness and sporadic bouts of depression—but there is nothing particularly unusual about that.
The significance of mental health problems needs to be looked at in the round, rather than simply in relation to mass killings, and is addressed in part 6.1.5, "Reducing the risk of misuse by the mentally disordered". It is sufficient to note at this point that the brief summaries of "Principal Firearms Incidents" which are attached as appendix 3 are much more supportive of the Walters view than that of the SSANZ.
As to the second issue which has attracted some controversy, the role of firearms in mass killings, Walters says:
Mass murders in Western countries almost always involve firearms (although there are cases involving bombs, poisons and knives). In many instances, the perpetrators are current or past licensed gun owners, often with a liking for military-type paraphernalia or ‘powerful’ weaponry such as military-style semi-automatic firearms. Research shows that the gun is the weapon of choice because of its capacity to kill rapidly. … It is not, however, military-style semi-automatic or automatic firearms that are most frequently used in mass killings. It is shotguns and rifles (most often semi-automatic).
Although the emphasis is somewhat different, that view is not entirely at odds with that put forward by SSANZ:
SSANZ has stated all along that the type of gun used at mass murders is a red herring and that the preoccupation of the 1992 Arms Act Amendment on restricting types of guns according to their appearance, is an absurdity.
Of the incidents listed above, those at Port Arthur and Aramoana involved the use of military style semi-automatic firearms. At Dunblane, Hamilton used two semi-automatic centrefire pistols, which in terms of functionality are broadly comparable to MSSAs. Bain used a .22 calibre semi-automatic rifle fitted with a silencer, and Schlaepfer used a double-barrelled 12-gauge shotgun at Paerata.
Clearly mass killings are not exclusively carried out with MSSAs. However equally such firearms have been a significant feature of many of the incidents in this part of the world, and their suitability for such a purpose cannot be ignored. SSANZ is correct to observe that it is not only the functional capability of the MSSA which has led to its restriction, but also its appearance. As to functionality, it is the capacity for uninterrupted and high-speed discharge which makes the firearm useful to the military and objectionable to many others. As to appearance, some of the features of the MSSA which might be considered cosmetic¾ for example the pistol grip¾ do in fact have some functional relevance. A pistol grip enables the firearm to be operated "from the hip." Bayonet lugs, although harmless in themselves, allow the affixing of potentially lethal capability. More importantly the combination of its cosmetic features tends to make the firearm more attractive to those who have an unhealthy fascination with violence or killing. As to the merits of further restricting such firearms there is further discussion in part 6.
At the same time the role of non-military style firearms in mass killings cannot be ignored. While MSSAs have featured in 43 percent of such killings, a proportion far higher than their proportion of the total armoury, it still remains that other rifles, or shotguns, have been the weapons of choice in the remaining 57 percent. On present information it appears that non-military style firearms have been used more often in domestic mass killings than in those where the victims have been strangers. This is a further matter which points to a need for some control over the whole armoury.
3.1.5 Firearms and family violence
The Use of Firearms in Family Violence
Family violence makes up a significant proportion of some forms of firearm crime particularly the more serious offences. In 1996 over half reported "serious assaults" with firearms were in the family violence category, and over the period 1992–1994 around half of firearms homicides were domestic-related. A lower but still significant proportion was shown by a study of 123 "Threats to kill/do GBH (firearms) offences" in 1994, which found that 22 (18 percent) were domestic-related.
When the relationship is looked at the other way around the patterns are broadly similar. As a proportion of all family violence incidents, those involving firearms are quite rare, but family homicides and some other forms of family violence do involve a higher proportion of firearm incidents. This somewhat mirrors the situation in relation to violence overall, where firearm incidents are only around 2 percent of total violence, but some violent offences, for example homicide, show a much higher involvement of firearms.
An important remaining area of uncertainty is the use of firearms to threaten in situations which do not result in reported offences. In his submission to this Review, Neville Robertson of the University of Waikato expressed the view that:
… [T]he use of firearms in killings is only the tip of the iceberg. The extent of using firearms in domestic violence is largely hidden because in the vast majority of cases, the weapons are not used to kill but to intimidate and terrorise. Such incidents are rarely reported to the Police.
This view was supported by research into breaches of domestic protection orders. Of 20 case studies, eight involved threats using firearms. Examples given included:
a) One woman who reported systematic verbal abuse, intimidation and standover tactics. On several occasions her husband poked her in the stomach with a gun and threatened to "blow her away", because she was "useless". …
b) One woman who shared her husband’s interest in sports shooting reported that weapons were often around the house and that her husband often made threats to shoot her. She felt that he was capable of this. So too, did his own brothers and sisters. On one of the occasions she attempted to leave, her husband coaxed her to return "just to talk". She did and had to discuss reconciliation with his shotgun, cocked, on the table. He told her he would "blow her away" if she did not come back to him.
c) Another woman reported that after an argument with her husband, he sat in the lounge cleaning his three guns. She felt that he did this in order to intimidate her.
d) One woman reported regular use of a firearm to intimidate. The first occasion followed an argument which saw her spending the night in another bedroom. In the morning, while she was in the bath, her partner brought a rifle into the bathroom and told her that if she left him, she would not get out of the area alive. A frequent terrorising tactic was to discharge the rifle by the bedroom window while she was asleep. She commented that he seemed pleased to see the fear this evoked as she awoke startled.
Mr Robertson commented that "[s]uch incidents are not uncommon in the experience of women’s refuge workers. Even in my own experience of working with abusers, it is not uncommon for men to volunteer the information that they have used firearms to intimidate their partners". In 1993 the Women’s Refuge Foundation reported that of 7,779 children who had stayed in refuges in 1992, 23 percent had been threatened with guns. While this lends support to the proposition that such threats do occur, there is no research in New Zealand which estimates the overall amount of threatened use of firearms in family violence. For present purposes it is clearly appropriate to acknowledge that firearms are used in domestic situations to threaten, but there is insufficient information available to allow comment on the frequency with which that occurs. Of course the fact that this behaviour cannot be quantified does not mean that it does not exist, nor that reasonable strategies should not be investigated to try to reduce it.
The Licence Status of Those Involved in Family Violence
Three separate studies in New Zealand support the proposition that the majority of those who use firearms in family violence are licensed shooters. Although each tends to support that conclusion, none of the studies has proceeded from a comprehensive empirical basis, and further more detailed research is desirable.
The Domestic Violence Act 1995
Domestic violence legislation in New Zealand now includes quite strict provisions dealing with firearms. Under the 1995 Domestic Violence Act it is a standard condition of every protection order that the respondent must not possess or control any weapon (including firearms) for the duration of the order. In the case of temporary protection orders any firearms licence held by the respondent is deemed to be suspended for the period of the order, and the respondent is
required to surrender the licence plus all weapons in his or her possession to the Police on demand. In the case of final protection orders, the respondent’s firearms licence is deemed to be revoked. Although the Act provides for discretionary seizure of firearms, police policy goes further and institutes de facto mandatory seizure. Respondents who fail to surrender on demand all firearms in their possession, or their firearms licence, may be arrested for breach of the protection order.The information which is available shows that around 8 to 10 percent of protection orders currently involve firearms held by either licensed or unlicensed owners. This proportion is lower than the average number of households containing firearms, possibly because of the largely urban nature of protection orders.
In the time available for this Review it has not been possible to conclude what the effect of the new provisions in relation to firearms will be. Those enquiries which have been made have shown no evidence that the firearms provisions are causing undue hardship or striking practical difficulties. There has been no call for stricter provisions, and at this time further reform would very likely be premature, in the absence of reliable information as to the effect of the new Act.
3.2 Suicide
The greatest proportion of deaths from firearms are suicides. They make up 73 percent of firearms deaths, while homicide accounts for 16 percent and accidental death 9 percent.
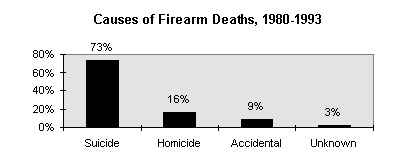 Sources: IPRU
and New Zealand Police
The most recent information available suggests that there is an average of 74 firearm suicides each year. In addition to that figure, approximately 13 people are admitted to hospital each year with non-fatal injuries from suicide attempts made with firearms.
Over the past three decades there has been an increase in the number of firearm suicides, as the graph below demonstrates. Numbers have increased by 40 percent over the period, from 52 in 1960, to 73 in 1993:
Sources: Forsyth and IPRU
Over the same period the total number of suicides has almost doubled, from 230 in 1960, to 443 in 1993. (Unofficial reports suggest that such increases have continued, if not accelerated.) In comparison, the number of firearm suicides appears relatively stable.
Sources: Forsyth and IPRU
One possibility is that the declining rural population has reduced the numbers of those with the easiest access to firearms, but there is no solid evidence to explain the trends.
Means of Suicide
While suicides make up a large proportion of the total deaths from firearms, firearm suicides are not the most prevalent method of suicide. Firearm suicides currently account for approximately 18 percent of the total suicides each year.
Means of Suicide, 1980–1993
| Means | Percentage of total |
| Hanging/suffocation | 30.5 |
| Gases and vapours | 23.0 |
| Firearms (incl explosives) | 18.3 |
| Poisoning (solid/liquid substance) | 14.1 |
| Jumping from high place | 4.3 |
| Drowning | 4.2 |
| Other (incl late effects) | 3.4 |
| Cutting and piercing instrument | 2.2 |
Source: IPRU
Firearms are the third most lethal method of suicide, after explosives, and hanging/suffocation.
Relative Lethality of Means of Suicide, 1980–1993
| Means | Attempts |
Deaths |
Total |
Fatality rate (%) |
| Explosives | 2 |
22 |
24 |
91.70 |
| Hanging/suffocation | 245 |
1,758 |
2,003 |
87.80 |
| Firearms | 176 |
1,035 |
1,211 |
85.50 |
| Drowning | 61 |
241 |
302 |
79.80 |
| Other gases and vapours | 549 |
1310 |
1859 |
70.50 |
| Jumping from high place | 208 |
250 |
458 |
54.60 |
| Poisoning (gases in domestic use) | 43 |
18 |
61 |
29.50 |
| Other/unspecified | 498 |
198 |
696 |
28.40 |
| Cutting and piercing instrument | 1,858 |
126 |
2,066 |
6.10 |
| Poisoning (solid/liquid substance) | 30,456 |
814 |
31,270 |
2.60 |
| Late effects of self-inflicted injury | 78 |
1 |
79 |
1.30 |
Source: IPRU
The lethality of firearms as compared with other means of suicide is reflected in the relatively small proportion of unsuccessful suicide attempts by firearms. While 18 percent of suicides between 1980 and 1993 were caused by firearms, firearms were involved in only 0.51 percent of attempted suicides over the same period.
A study undertaken by Beautrais et al in 1996, as part of the Canterbury Suicide Project, also considered the prevalence and lethality of different methods of suicide. This study included a sample group of successful and non-successful but medically serious attempts at suicide. Of this group, the most common method of suicide was carbon monoxide poisoning, accounting for 37.3 percent of deaths amongst the group. 13.3 percent of the deaths were attributable to firearms.
These results show a smaller percentage of firearm suicide deaths than the IPRU figures, but a greater proportion of carbon monoxide deaths. However, the Beautrais study also found a very small percentage of unsuccessful suicide attempts by firearms, due to their high lethality rate.
| Method | Suicide, using method (%) |
Attempts, using method (%) |
Total fatal (%) |
| Carbon monoxide poisoning | 37.3 |
9.3 |
66.7 |
| Hanging | 28.0 |
3.0 |
82.4 |
| Gunshot | 13.3 |
1.3 |
83.3 |
| Overdose/poisoning | 13.3 |
76.8 |
7.9 |
| Other methods | 8.0 |
9.6 |
29.3 |
| Total | 100 |
100 |
42.6 |
Source: IRPU
As the table above shows, firearms were found to be the most lethal method of suicide, with a 83.3 percent fatality rate. Hanging was found to be almost as lethal, with a fatality rate of 82.4 percent. Carbon monoxide had a 66.7 percent fatality rate, while attempts by poisoning had a fatality rate of 7.9 percent. These results accord roughly with the IPRU figures as to relative lethality, although the Beautrais study found firearms to be slightly more lethal than hanging, whereas the IPRU figures suggest the opposite.
This study also found that a clear majority (91.7 percent) of those who attempted suicide were male, and 66.7 percent were aged 25 years or older.
Risk Factors
The literature obtained for the purposes of this Review makes it plain that there is a complex and inter-related set of risk factors involved in suicide and attempted suicide. These factors, and the possibility of taking any steps which may influence the likelihood of firearm suicide, are dealt with in parts 4.3 and 6.1.5.
3.3 Accidental Death And Injury
Firearms accidents are and always have been an inevitable corollary of firearm usage, a point made in typically picturesque prose by Forsyth:
Arms accidents have been with us longer than firearms. Swords probably slipped, slings surely "let go" at the wrong moment and it is inconceivable that arrows went the right way all the time.
Figures from the IPRU indicate that between 1980 and 1993, 121 people were killed and 873 people were admitted to hospital with injuries as a result of firearms accidents. Over the period this is an average of around nine deaths and 62 hospital admissions a year¾ approximately 9 percent of firearms deaths and 65 percent of firearms hospital admissions.
The other main basis for estimating the level of firearm accidents is data from ACC which shows the number of claims for compensation. These figures show an average of nine deaths and 53 injuries per year from 1992 to 1996. The true level of injuries is likely to be higher than these figures.
Accidental Deaths
Over the period 1980 to 1993 the number of accidental deaths per year showed no consistent increase or decrease.
Source: IPRU
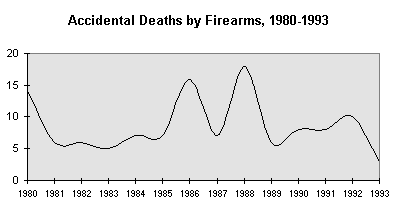
ACC figures are available from 1993 to 1995, and these indicate a three-year average of 12 deaths a year.
| Cause of Death | Number of deaths |
Proportion of total (%) |
| Motor vehicle traffic | 9,723 |
50.40 |
| Falls | 3,806 |
19.70 |
| Submersion | 1,022 |
5.30 |
| Water transportation | 614 |
3.20 |
| Suffocation and respiratory obstruction | 544 |
2.80 |
| Air transportation | 487 |
2.50 |
| Fire and flames | 447 |
2.30 |
| Machinery | 331 |
1.70 |
| Motor vehicle non-traffic | 292 |
1.50 |
| Late effects of injury | 243 |
1.30 |
| Falling object | 214 |
1.10 |
| Environmental | 194 |
1.00 |
| Railway | 164 |
0.85 |
| Poisoning non-medical source | 151 |
0.78 |
| Electric current | 136 |
0.70 |
| Poisoning | 135 |
0.69 |
| Medical misadventure | 132 |
0.68 |
| Firearm missile | 121 |
0.63 |
Source: IPRU
Firearms are a relatively infrequent cause of accidental death, making up only 0.63 percent of such deaths over the period 1980 to 1993. By far the greatest proportion of accidental deaths is caused by motor vehicle accidents¾ these made up 50 percent of accidental deaths during the period.
Simple comparisons between firearms deaths and other types of death are however potentially misleading. Motor vehicles are more frequently used by a greater number of people in closer proximity to each other than is the case with firearms, making a higher number of deaths in motor vehicle crashes unsurprising. Furthermore, as in all other areas, the absolute size of the problem must be considered, not just the comparative size. The facts remain that an average of nine people per annum are killed in firearms accidents, and this average has not noticeably declined in the past decade and a half.
Over the period 1980 to 1993 the number of admissions to hospital for accidental firearms injuries remained reasonably stable.
Source: IPRU
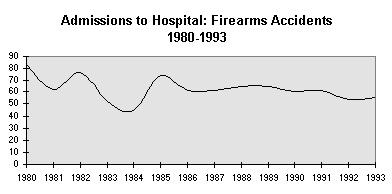
While there is a significantly greater number of accidental injuries than deaths caused by firearms, these make up an even smaller percentage of the total number of accidental injuries¾ 0.13 percent over the period 1980 to 1993.
Accidental Injuries, 1980–1993
| Cause of injury | Admissions to hospital |
Proportion of total (%) |
| Falls | 187,747 |
31.70 |
| Motor vehicle traffic | 119,232 |
20.10 |
| Cutting or piercing instrument | 44,739 |
7.60 |
| Struck by person or object | 43,366 |
7.30 |
| Other road vehicles | 27,865 |
4.70 |
| Medical complication NEC | 26,912 |
4.50 |
| Late effects of injury | 21,066 |
3.60 |
| Over-exertion and strenuous movements | 15,026 |
2.50 |
| Machinery | 13,970 |
2.40 |
| Foreign body | 9,587 |
1.60 |
| Environmental | 9,529 |
1.60 |
| Poisoning medical source | 9,437 |
1.60 |
| Poisoning non-medical source | 7,825 |
1.30 |
| Caught in/between object(s) | 6,949 |
1.20 |
| Falling object | 6,535 |
1.10 |
| Fire and flames | 3,771 |
0.64 |
| Other environmental | 2,967 |
0.50 |
| Water transportation | 2,558 |
0.43 |
| Suffocation and respiratory obstruction | 2,268 |
0.38 |
| Adverse effects of medication | 2,245 |
0.38 |
| Air transportation | 1,234 |
0.21 |
| Submersion | 1,224 |
0.21 |
| Explosive material | 1,039 |
0.18 |
| Electric current | 885 |
0.15 |
| Firearm missile | 873 |
0.13 |
Source: IPRU
However, as with deaths, simplistic comparisons should be avoided because of the different nature of the activities involved. The important point is that no fewer than one person a week is injured in a firearms accident, again without significant reduction in the last decade and a half.
Causes of Firearms Accidents
As to the causes of firearms accidents in New Zealand, the most thorough study remains that completed by Forsyth for the Mountain Safety Council in 1985. In the time available it has not been possible to update Forsyth’s work. Although no longer contemporary, the main conclusions from Firearms in New Zealand deserve reiteration. As at 1985:
1. While approximately 15 percent of the population was between 16 and 30 years of age, more than 45 percent of the accidents were caused by people in this age bracket.
2. Almost half of all firearms accidents occurred at home.
3. 45 percent of accidents involved experienced shooters and 55 percent inexperienced shooters (suggesting that experience alone is insufficient to promote safe practice).
4. Apparent causes of firearms accidents included:
| Apparent cause of accident | Total |
Percentage |
| Leaving firearm loaded | 61 |
26.5 |
| Other causes (excluding suicide) | 35 |
15.2 |
| Liquor involved | 20 |
8.7 |
| Firing at movement | 16 |
7.0 |
| Defective firearm | 13 |
5.7 |
| Victim not visible to shooter | 13 |
5.7 |
| Crossing ditch or fence | 9 |
3.9 |
| Dropping or throwing firearm | 8 |
3.5 |
| Pulling firearm towards self by muzzle | 8 |
3.5 |
| Riding in vehicle with loaded firearm | 8 |
3.5 |
| Victim moved into line of fire | 7 |
3.0 |
| Removing firearm from vehicle | 7 |
3.0 |
| Loading | 7 |
3.0 |
| Unloading | 7 |
3.0 |
| Placing firearm in vehicle | 5 |
2.2 |
| Ricochet | 5 |
2.2 |
| Firing at sound | 1 |
0.4 |
Source: Forsyth, Firearms in New Zealand
The causes of accidents so determined provided the basis for the "5 basic rules of firearms safety", the forerunner to the MSC "Firearms Safety Code". Unfortunately data are not available in New Zealand to place firearm accident victims into separate classes for urban and rural dwellers, or males and females. There is however no reason to believe that New Zealand is any different from Australia, where rural males make up the majority of accidental death and injury victims.
It is not in any way a criticism of the excellent firearms safety training work done by the Mountain Safety Council to observe that there appears to be room for improvement in New Zealand’s rates of accidental death and injury from firearms.
For most of the last 25 years New Zealand has matched the Australian record in respect of firearm accidental death and injury. Indeed the Council’s programmes have been highly regarded, and adopted, by different Australian States. Recent Australian figures suggest that our neighbours have now overtaken us. Over the period 1992 to 1995 the rate of accidental death per 100,000 persons in this country was 2½ times that of Australia. Looking just at 1995, New Zealand’s rate per 100,000 persons was four times higher than Australia’s. In that year, 12 people died in firearms accidents in New Zealand, compared to 15 such deaths in Australia. Of at least equal significance is the fact that Australia’s accidental death rate is showing obvious and consistent signs of decrease, as opposed to New Zealand’s which shows a much smaller decrease. One possible initiative¾ the practical training of shooters¾ is addressed in part 6.2.2.
The evidence gives no indication that New Zealand faces some new crisis of firearm misuse, but rather that the major increases which occurred in all violent offending from the 1960s have been replicated in firearm crime, the level of which is relatively stable, but at an unacceptably high level.
International comparisons of firearms statistics should be treated with some caution. However it is comforting to see that New Zealand’s firearm homicide ratio appears to be lower than that in Australia and Canada¾ and less than one-third of that in the United States.
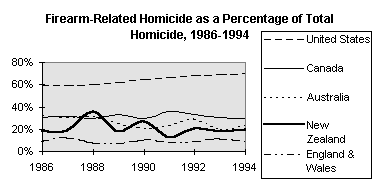
Source: NZ and Australian Institute of Criminology
Our rate of firearms suicide does not compare so favourably internationally, as the graph below demonstrates. While substantially less than the United States, our firearm suicide rate is nearly twice as high as the average rate amongst United Nations Member States, and over seven times higher than the United Kingdom:
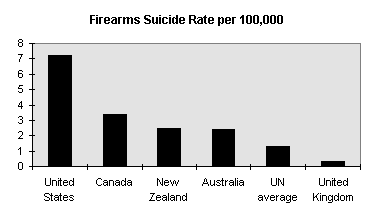
Source: Draft United Nations International Study on Firearms Regulation (1997)
In broad terms the problem of firearm misuse in this country is neither as bad as many believe, nor as insignificant as others claim. In proportional terms there are many risks in New Zealand of greater magnitude than the risk of firearms misuse. However the level of such misuse is higher than should be tolerated, and many of the reforms in part 6 are directed towards reducing that risk.
Return
to the Project Table of ContentsNotes
Triggs, Interpreting Trends in Recorded Crime in New Zealand, 1997, at 17.
For a recent review of the overseas literature, see the principal submission by J.A. Stevenson to the Dunblane Inquiry (Lord Cullen, The Public Enquiry into the Shootings at Dunblane Primary School on 13 March 1996), at 1- 9.
At vii. The report is dated March 1997, but has not been released at the time of compiling this report.
Source: New Zealand Yearbook, 1996; see also Statistics New Zealand, New Zealand Now Crime Tables, 1996.
Statistics New Zealand, New Zealand Now Crime, 1996, at 9.
In absolute numbers, violent offences rose to a level of 45,454 in 1995, and decreased slightly to 45,191 in 1996.
Supra at note 5, at 15.
The Police first adopted a policy of arrest for violence arising out of domestic incidents in 1987. This policy was reinforced and restated by the Commissioner in Ten One 1993, 49 (27 August). For further discussion of this factor see Triggs, supra at note 1, at 53.
Substantial increases occurred over the 1992- 1995 period for assault using firearms; manual assaults, assaults causing injury; minor assaults; kidnapping and abduction; and serious and minor threats. The only violence group which did not increase was homicide: Triggs, supra at note 1, at 53. In the case of non-domestic violence, it seems that an increasing focus on community policing and a commitment to curbing street violence and disorder (NZ Police 1993) may also have had an effect on reporting rates: ibid.
The absence of a trend for homicide further suggests that the increase in violent offences may have been attributable to reporting practices, since homicide is the offence least likely to be affected by reporting trends: ibid, at 54.
For explanations of these categories, see supra at note 5, at 21.
Victoria Link Ltd and AGB McNair, "The New Zealand National Survey of Crime Victims", 1997, at 77.
Ibid.
Norton, "Firearm Related Deaths in New Zealand 1978- 87" New Zealand Medical Journal 1993, 106.
Source: Statistics New Zealand, supra at note 5, at 14; Planning and Policy Group (PNHQ), Firearm Statistics.
Ibid.
It may also be noted that nine people were killed in Masterton in 1992 with a hammer and six people were killed in Hamilton in an arson attack in 1995.
The two cases of which I am aware of before Aramoana are Hona (9 October 1934) and Graham (20 October 1941).
Firearm homicides includes murder, manslaughter and infanticide. There were 92 people killed in such homicides over the period 1990- 1994, as compared with 24 killed in the Aramoana, Bain and Schlaepfer incidents.
In the United Kingdom, by 15 May 1997 over 700,000 people had signed the official "Snowdrop Petition" for gun control following the shooting at Dunblane. A Newspoll survey conducted in Australia in the wake of the Port Arthur massacre indicated that 68 percent of people believed the proposed gun law reforms were about right or could be even stricter.
Walters, "Mass Murder¾ What Do We Know?" Criminology (newsletter of the Institute of Criminology, Victoria University of Wellington) 1997, 7 (March).
A Colt AR15 .223 cal. semi-automatic rifle and Fabrique Nationale .308 cal. semi-automatic rifle at Port Arthur and a .223 Norinco semi-automatic AK47 lookalike at Aramoana.
Of 85 serious assaults, 39 were "Assaults child (firearm)", 16 were "Male assaults female (firearm)" and nine were "Common Assault (domestic) (firearm)"¾ a total of 75 percent. Although all of these offences may not have been family violence, police estimate that 80 percent of "male assaults female" offences are family violence. It seems reasonable to conclude on balance that over 50 percent of the offences were likely have been family violence. Research by Alpers and Morgan in 1995 found that of the 40 people murdered with firearms between 1992 and 1994, 55 percent were killed in the course of family violence (63 percent if perpetrators are included): see Alpers and Morgan, "Firearm Homicide in New Zealand: Victims, Perpetrators and Their Weapons 1992- 94", at 2. Police calculations showed 23 domestic homicides involving firearms, giving a proportion of 58 percent: see Police, "Domestic Violence Bill: Firearms Surrender or Seizure upon the Making of Protection Orders", 1995, at 2. The Alpers and Morgan study was criticised by some because it included the Bain and Schlaepfer homicides which added a total of nine victims between them. However if these two incidents are removed from the analysis the results show 42 percent of victims shot in family violence incidents. Either way the proportion is significant.
Police, ibid, at 5.
A 1995 study of police offence records for a six-month period found that only 0.6 percent of family violence offences involved firearms. Similarly, a study of 188 cases in which children witnessed family violence, found only 1 percent involved firearms: see Maxwell, Children and Family Violence: The Unnoticed Victims, 1994, at 4. The sample of 188 cases was drawn from the main study group of 528 records which in turn represented just under half the police incidents reported to HAIPP over the three-year period.
Police analysis of offence statistics from 1992 to 1994 showed that firearms accounted for 42 percent of domestic homicides in that period, and study in 1991 found that firearms were used in approximately one-third of partner homicides: see Police, ibid, at 2; and Fanslow, "Epidemiology of Partnership Homicide: New Zealand 1978- 1987", paper presented to the Family Violence Prevention Coordinating Committee Conference, Christchurch, 1991.
Busch and Robertson, Protection from Family Violence: A Study of Protection Orders Under the Domestic Protection Act 1982, 1992.
See Alpers and Morgan, supra at note 23; and Langley, Norton and Alpers, "Firearm Misuse: Licence Status of Perpetrators and Legality of the Firearms". In February 1997, police surveyed family violence coordinators from 17 districts, covering approximately two-thirds of the country. The coordinators indicated that in their experience only a small proportion of respondents with firearms are unlicensed. The average estimate was 4 percent; however, this finding should be viewed with some caution: of 16 coordinators who made an estimate, 11 estimated 0 percent, while the other five estimated between 5 and 20 percent. The variation in the data makes the average of 4 percent somewhat open to question. Although it is possible that some women avoid disclosing that their partners are in possession of firearms without a licence for fear that this may make their situation worse, the result does provide some support for the proposition.
Section 21(1)(a), Domestic Violence Act 1995.
Section 21(2)(a), Domestic Violence Act 1995.
Section 21(1)(c), Domestic Violence Act 1995.
Section 21(2)(b), Domestic Violence Act 1995.
See 121 Ten One 11, 12 July 1996.
The results of the February 1997 survey of family violence coordinators found that of 1,948 protection orders received by police, firearms or a licence were present in 163 or 8.4 percent. An earlier sample to October 1996 had found 10.5 percent with firearms. At first blush these results are surprisingly low given that the survey carried out by AGB McNair found that firearms are owned in an average of 20 percent of households in New Zealand. However, closer analysis shows that approximately 83 percent of the protection orders in the police sample were in urban areas. AGB’s results broken down by area indicate that firearms arowned in 10 percent of metropolitan, 20 percent in provincial households and 37 percent in small town/rural households. The Auckland and Wellington regions each showed 8 percent ownership. This would tend to indicate that the low proportion of protection orders involving firearms may be due largely to the urban nature of the orders.
A survey of family violence coordinators for the purposes of this Review found no difficulties with the operation of this policy and indicated a general belief among coordinators that the law is being complied with.
Homicide figures are supplied by the New Zealand Police; the remainder by IPRU.
Ibid. This estimate is based on the average number of suicides each year over the period 1980- 1993.
Ibid. The numbers of hospitalisations recorded by IPRU include readmissions and thus may count one attempt at suicide more than once if successive treatments are required.
Data for the years 1960- 1979 are from Forsyth, Mountain Safety Manual¾ Firearms in New Zealand, July 1985; data for the years 1980- 1993 are from IPRU.
Source: Forsyth, ibid.
Source: IPRU.
Source: IPRU. The number of suicide attempts will only include those serious enough to warrant hospitalisation, as IPRU figures are based on the recorded number of persons discharged from hospital.
Beautrais, Joyce and Mulder, "Access to Firearms and Risk of Suicide: A Case Control Study" Australian and New Zealand Journal of Psychiatry 1996 (December), 741.
Those which required hospital admission for longer than 24 hours and which met specified criteria: ibid, at 742.
Includes cutting or stabbing, electrocution, drowning, jumping from a height and other "uncommon methods": ibid, at 744.
Ibid.
Forsyth, supra at note 39, at 1.
Source: IPRU, Otago Medical School. The hospital admissions data include re-admissions, and since the same injury may result in more than one admission, the figures may be inflated to an unknown extent.
These figures show ten deaths in 1993, 15 in 1994 and 12 in 1995¾ an average of 12 per annum.
See Forsyth, supra at note 39, at 18.
Ibid, at 16, citing figures supplied by the NZDA and MSC.
Sources: ACC and National Injury Surveillance Unit, Flinders University. The New Zealand average is 0.27 deaths per 100,000 population; Australia’s average is 0.11.
See Australian Institute of Criminology, Violent Deaths & Firearms in Australia: Data & Trends, 1996.